Determining the potential of carpooling…
Considering the real possibilities for sharing journeys and the knock-on effects.
Nolwen Biard, septiembre 2023
If the potential attributed by local authorities or the State to the development of daily car-sharing often seems like a « horizon », this can be explained in part by the difficulty encountered in determining the real weight of the practice in the daily journeys of French men and women. Indeed, sharing the same vehicle is a practice for which intermediation is relatively new, as is the production of daily « proof » of journeys made by carpooling, with the appearance of the Carpooling Proof Register.
Para descargar: 2023.09.11_vf_etude_covoiturage.pdf (5 MiB)
Current levels of carpooling for daily mobility
No survey provides a comprehensive overview of carpooling
The Carpool Proof Register only records a small proportion of journeys, and a majority of carpooling practices therefore leave no tangible traces. They can only be apprehended through mobility surveys. At national level, INSEE’s Mobilité des Personnes (EMP) survey, carried out every ten to fifteen years, details the mobility practices and socio-demographic characteristics of individuals using a large representative panel. The data for the latest edition was collected in 2019 and published in open-data form in early 2022. It is only in this latest edition that some more specific questions on carpooling appear, notably on the mode of contact or the existence or absence of financial compensation, albeit with a small number of respondents. Cerema’s Enquêtes Ménage Déplacements (EMD), now known as Enquêtes Mobilité Certifiées Cerema (EMC²), are surveys carried out on the scale of a specific territory. The analyses drawn from these surveys increasingly include a section on carpooling (level of practice, frequency, sometimes age and/or CSP).
The other obstacle to determining a modal share for carpooling is the variation in definitions from one survey to another. Trips made as a passenger in a car do not correspond exclusively to carpooling trips, since this would mean counting accompanying trips, which do not fall within the definition of carpooling in the Transport Code 1. So, even if 28% of car journeys are made by an accompanied driver according to EMP 2019, this does not mean that 28% of car journeys are carpooled. In a CGDD 2022 note, carpooling is considered from a limited perspective, since only the practices of passengers traveling in a car outside their household are taken into account. In the EMC for the Greater Grenoble region, carpooling is defined as a journey made by car with a person who does not share the same dwelling. An ADEME report published in 2015, analyzing data from the 2008 Insee Mobility Survey, takes into account both carpooling between members of the same household (intrafamilial carpooling) and carpooling between people from different households (extrafamilial carpooling). In order not to measure companion trips, the report only looks at commuting or home-study carpooling. As a result, variations in definition can alter measured levels of carpooling and complicate comparisons.
Carpooling, overwhelmingly informal, is not widely practiced on a daily basis
The first indicator of carpooling is the occupancy rate, which tells us the average number of people in a car (driver and passengers, if any). As mentioned in the first section, this occupancy rate is trending downwards: it stands at 1.43 for local mobility, and only 1.08 for commuting. A second indicator is the modal share of carpooling. If we look at individuals who carpool, we can determine a modal share for people who carpool every day, and a second one considering a more occasional practice 2. According to the ADEME-Inddigo study (2015), 900,000 people carpool to work every day, and 100,000 major students3. There would therefore be 1 million regular carpoolers every day making commuting trips to school or work. Considering more occasional carpoolers, 1.3 million working people and 200,000 students carpool at least part of the way, but not necessarily every day. On this broader assumption, carpooling is practiced at least occasionally for journeys to work or study by 1.5 million people.
Based on the 2019 INSEE Mobility Survey, the modal share of daily carpooling is estimated at 4% of passenger journeys (CGDD, 2022), considering here only passenger journeys made in a vehicle not belonging to their household. The weight of carpooling in local trips is therefore low overall. Based on the assumption of the Plan covoiturage 2023 - 2027 (900,000 daily carpooling trips), and depending on the type of trip considered, we can estimate that 0.5% of daily trips are made by carpooling. Platform carpooling is still much lower: at an average of 14,000 daily trips in 2022, it represented 0.01% of daily trips, and 0.02% in the first quarter of 2023 (see table below). The objectives of the Carpooling Plan are to increase the number of daily trips made by carpooling to 3 million, i.e. 1.8% of all daily trips and up to 6% of home-work trips. By way of comparison, around 16% of home-to-work journeys were made by public transport and 2% by bicycle, in 20174
Theoretical potential for trip-sharing far removed from existing practices and persistent resistance
Foresight scenarios model a theoretical potential…
A number of forward-looking scenarios published over the last ten years or so have calculated the development potential of car-sharing and its contribution to decarbonization, along the lines of the SNBC, i.e. with assumptions about vehicle sharing that are well above current levels. The three scenarios studied here model current road flows and determine the number of journeys with a common origin and destination, in order to determine a « carpooling potential » or « matching potential ». This potential then varies according to various criteria or assumptions.
The study by the French Commissariat Général du Développement Durable (CGDD), written by A-L. Biotteau (2014), determines a reduction rate for cars on the road based on a simple model, starting with the number of individuals making the same trip (same commune of residence (origin) and same commune of work (destination), same departure and return times). The hypothesis is then enriched by differentiating trip types, grouping socio-occupational categories and dividing urban areas. The study concludes that the number of vehicles on the road would be reduced by at least 2% in rural areas, and by almost 16% in densely populated urban areas, per working day. The reduction in CO2 emissions would range from 2,846 tonnes of CO2 emissions (low estimate) to 4,537 tonnes of CO2 emissions (high estimate), i.e. a reduction of between 4% and over 6.6%.
C. Raux, et al, (2018) vary the potential of carpooling between three territories located in French metropolises, considering only the work-related loops of the active population5. Two hypotheses were chosen to make the calculated potential more realistic: a first hypothesis on the percentage of people potentially concerned who actually switch to carpooling, i.e. who overcome organizational difficulties and other barriers, and a second on the occupancy rate, which varies from 2 to 4 depending on the size of the groups matched by common OD. Finally, the effects of developing car-sharing on CO2 emissions are highest for Lyon’s Metropolitan Square (-20% by 2050 for the high voluntarist scenario), but remain high for the other two peri-urban territories studied (-14% and -16% by 2050).
Finally, the Shift Project report focuses only on medium-density areas, on the basis of an efficient community car-sharing system. The report varies two scenarios, quantifying the number of carpoolable journeys (the reason and/or regularity of the journey determines whether it can be shared with another passenger) and the possible occupancy rate. A time flexibility of one hour is assumed (driver and passengers are willing to shift their departure time by 30 minutes). From this base, two scenarios are determined: the first, of maximum potential, assumes public policies highly favorable to the development of car-sharing. The second, known as « voluntarist », adds a number of criteria for the carpooling of journeys, to come closer to a real estimate. The potential reduction in CO2 emissions is estimated at 27% for the first scenario and 6.4% for the second.
The three studies mentioned above are based on the modelling of existing journeys to determine the rate of journeys that can be shared thanks to car-sharing. For the first two studies, the development of car-sharing has a greater impact on CO2 emissions in densely populated areas than in suburban or rural areas, as it is the number of journeys that can be shared that is taken into account. The relevance of pooling such journeys, made in areas where alternatives may be present or relevant, is not questioned. The third study focuses solely on medium-density areas, considered to be relevant for the development of car-sharing. It is nevertheless based on strong assumptions, notably a 30-minute time flexibility for the passenger or driver, as well as the existence of an efficient community car-sharing system and favorable public policies to remove all obstacles to the practice.
Or theorize a potential…
The other two scenarios presented here do not make precise calculations based on journeys made at the same times and between the same places. They adopt the opposite reasoning: it’s the type of public policies and their orientation that will influence the type of carpooling set up and the areas where it will be deployed. ADEME’s Transition(s) 2050 scenarios vary the potential of car-sharing widely between four prospective scenarios. These four « typical » paths all take France towards carbon neutrality in 2050, with very contrasting transition stories imagined for metropolitan France. The data remain at an aggregate level, and do not distinguish between travel motives, territories or people’s socio-economic profile. To determine the potential of car-sharing, each scenario proposes a hypothesis linked to the societal choices and lifestyles of its overall narrative. In particular, these prospective scenarios inform us about the direction of public car-sharing policies and the role of public and private players. The potential of car-sharing thus appears to be strongly linked to lifestyles and societal choices.
Spatial planning to encourage proximity and demobility, or the increased role of local authorities in implementing policies to support car-sharing, are the structuring elements of scenarios 1 and 2, enabling car-sharing to make an effective contribution to the effort to achieve carbon neutrality. In the third scenario, the State must develop substantial public policies to offset the paradoxical effects of its other mobility policies, in particular the electrification of the car fleet and the continuing predominance of cars outside urban areas. The fourth scenario is characterized by the growing role of technology and digital technology in our mobility, and a sharp increase in the number of kilometers traveled per person. In the end, car-sharing contributes very unevenly to the decarbonization effort: only - 1% emissions for scenario 4 and up to - 14% for the first scenario. On the other hand, in the trend scenario, the occupancy rate continues to fall, contributing to the rise in emissions (+2%).
The other prospective scenario studied is that of négaWatt, which highlights car-sharing lines, in particular those deployed by the operator Ecov6. In its sobriety plan presented in autumn 2022, négaWatt estimates that the deployment of 20,000 car-sharing lines across France, covering a third of the national network, could generate savings of 40 TWh. No indication is given, however, of the calculation method.
… without taking sufficient account of the real possibilities for pooling journeys
These different scenarios attempt to approach a credible potential by integrating several criteria that favor or diminish the likelihood of trip sharing. However, these criteria are generally not linked to real, existing carpooling practices. Yet these are an essential indicator for understanding the factors that encourage carpooling (even without the presence of financial incentives). We can distinguish various factors from the characteristics of carpooling practices detailed in the 2015 ADEME-Inddigo study. First of all, because carpooling involves organizational constraints and therefore wasted time, the distance factor is decisive in understanding the practice. Indeed, the shorter the trip distance, the greater the percentage of time lost to carpooling, particularly for extra-familial trips requiring longer connection times (dropping off or picking up the passenger) than for individuals from the same household living in the same dwelling. This explains why the average distance for extrafamilial home-work carpooling is 20 km (ADEME-Inddigo, 2015), higher than the average distance for home-work journeys (13.3 km). What’s more, the proportion of trips carpooled outside the household doubles beyond 20 km. The socio-economic factor is also important in understanding the potential of carpooling. Carpooling to work is much more common among blue-collar workers, and/or households with incomes below 3,000 euros, and/or people with few or no qualifications. Conversely, people with higher levels of education, higher socio-professional categories and/or households with incomes in excess of 4,000 euros make much less use of carpooling. Thus, individuals with lower incomes are more likely to accept the loss of time associated with carpooling, as it enables them to share travel costs.
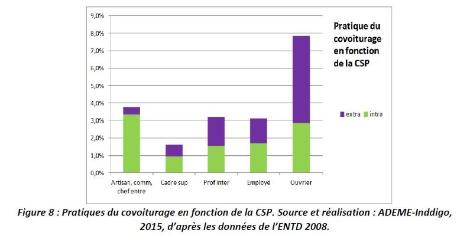
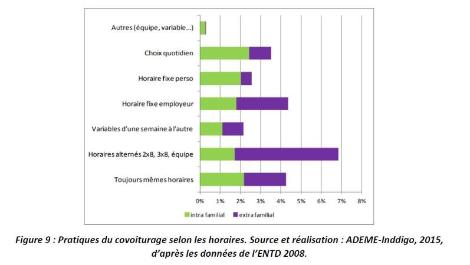
However, the significant discrepancy between blue-collar and white-collar workers observed in the graph above, testifies to the influence of other factors in the practice of carpooling, particularly outside the household. The ADEME report shows that extra-familial practices are much stronger for people with shift and staggered working hours (2x8 or 3x8), as well as for people with fixed or imposed working hours. Work organization is another factor that determines the practice.
Differences between the levels of practice of managers and workers can also be explained by place of residence: managers more often work in the heart of urban areas, which are better connected to transport networks, while workers mostly live in the suburbs and also work in the suburbs, and these suburb-to-suburb journeys are poorly covered by alternatives to the car (Lecomte, 2019). Carpooling may then be the only alternative to reduce the cost of commuting. From a perspective that goes beyond work-related travel alone, carpooling can also be organized to relieve a complex family schedule. For example, women are over-represented in carpooling trips where the motive is related to children (Aguilera, Pigalle, 2021). What’s more, the modelling exercises mentioned above calculate the potential of carpooling without taking into account the complexity of the journeys made in a day. Their estimates are based on the pooling of journeys between home and work, yet these direct trip chains between home and work are not in the majority for all population categories. For example, they account for only 40% of parents’ mobility (Demoli, Gilow, 2019): the other trip chains between home and work are interspersed with accompanying trips, errands and so on. This distribution is also highly gendered: travel chains polarized by work-related trips are predominantly male, while travel chains comprising accompanying or shopping trips are predominantly carried out by women. This « fragmentation » of mobility makes it difficult to share journeys with people from outside the household. What’s more, these hectic, jerky mobilities induce constraining spatio-temporal rhythms and obligations, which constitute a greater and more frequent mental burden for mothers (Demoli, Gilow, 2019). We can therefore assume that they have less leeway to accept the organizational constraints and temporal flexibility required to organize carpooling with 36 people from outside their household. Following a survey of working people in the western economic hub of Greater Lyon, urban geographer Sylvanie Godillon shows that complex personal organization is the main obstacle to carpooling for the majority of working car drivers. The individualization and flexibilization of working hours, particularly for executives, also complicates carpooling planning. So, to determine the real potential of carpooling, it’s not enough to note the actual presence of numerous journeys made apparently at the same times, to the same places. This is illustrated by the results of the various editions of ADEME’s annual Barometer survey on social representations of climate change. In this annual survey, a range of actions are proposed to respondents to reduce greenhouse gas emissions, including carpooling and carsharing. In the latest barometer published at the end of 2021, the « carpooling and carsharing » action was the least practiced (19% of respondents), and also the one perceived as the most difficult to implement among the dozen proposed actions: 22% felt they could do it, but with difficulty, and 36% felt they could not. This result is the highest compared to the results obtained for this question in previous editions of the Barometer (31% in 2011 felt they couldn’t get people to carpool or carshare): carpooling seems more difficult to organize today than ten years ago. For home-to-work journeys, car-pooling is a reflex for many working people, while car-pooling is low and encouraged by certain factors: a lower level of income, a certain organization of work (staggered, fixed and/or shift working hours), a certain distance to be covered, the absence of an alternative to the car… The absence of these constraints, or the difficulty of reconciling the practice of carpooling with other imperatives (family, for example) explains in part the recourse to autosolism and the low use of carpooling.
…or the strong resistance to a practice that runs counter to current mobility trends
Even if we assume that journeys can be shared and that conditions are optimal (direct journeys with no external imperatives, ease of contact, economic interest in sharing costs, etc.), the potential of car-sharing is limited by the persistence of strong resistance on the part of motorists. This is one of the findings of the Baromètre des mobilités du quotidien 2022 7, which questioned respondents’ willingness to try an alternative means of transport to the private car. Car-sharing and car-pooling are the most reluctant solutions: 34% of respondents would « certainly not » be prepared to try car-sharing or car-pooling in the next twelve months, even if the brakes were lifted, and 26% answered « probably not ». These solutions have the lowest take-up rate, compared with the other alternative transport solutions on offer (public transport, cycling and electric vehicles). This resistance can be explained by recent changes in the perception of travel time. Thanks to the spread of the smartphone and improved connection quality, enabling access to content, services, information and social relationships, « travel time is seen as a time more in continuity with the other times of daily life » (Wang et al., 2016, in Aguilera, Rallet, 2016). It is therefore possible to take advantage of one’s daily commuting time to carry out other activities in parallel. This commuting time can also be perceived as a decompression chamber, particularly for working people with child(ren) who feel they lack time for themselves (Godillon, 2021).
Public policies overestimate the potential of car-sharing
Ambitious decarbonization and energy-saving objectives attributed to the development of car-sharing
In his thesis, A. Bigo shows that the fall in car occupancy rates has had a strong impact on the rise in CO2 emissions since 1960 (+28% impact). While he believes that the downward trend in car occupancy rates should slow down or even stop, the SNBC’s gamble on a strong increase « remains a major challenge ». So, while the SNBC is not very ambitious on other sobriety levers, it comes close to the most ambitious scenarios for car-sharing (Bigo, 2020). In its forward-looking scenario, the SNBC associates an increase in the average occupancy rate of cars with an 11% drop in emissions from the transport sector by 2050. In 2019, the French government set itself a target for the development of car-sharing, originally scheduled for 2024. At the end of 2022, the deadline was pushed back to 2027. The aim is to increase the number of daily trips from « 900,000 to 3 million, saving 4.5 million tonnes of CO2 per year ». This corresponds to 2.1 million additional journeys every day of the year, with a distance of 30 km8. This is an optimistic assumption, since, as mentioned above, average journey distances tend to be around 20 km, and public policy efforts are particularly focused on home-work journeys, which are much less numerous during weekends and vacations. We should also consider the rebound effects of car-sharing, as we shall see later. The energy-saving assumptions underlying the distribution of Certificats d’économie d’énergie (energy-saving certificates) are also greatly overestimated, particularly in the case of the Plan covoiturage bonus for first-time drivers. This grants €100 to each driver who makes at least 10 journeys. However, the estimated energy savings are much higher than 10 journeys. For each CEE, the Ministry of Energy Transition estimates a saving of 19,700 cumulative and discounted kilowatt-hours (kWh cumac), which is equivalent to estimating that each new driver will systematically continue to carpool five days a week for five years, covering between 20 and 25 km each time, as reported in an Alternatives Economiques article published in May 20239.
The Carpooling Observatory reports on the presence of financial incentives rather than the real potential of intermediated carpooling.
L’Observatoire du covoiturage (the Carpooling Observatory) reports monthly on data from the RPC, enabling us to observe the dynamics of changes in carpooling. It also highlights the « 10 most car-shared journeys » and the « 10 territories » recording the most journeys. However, this ranking does not show the type of areas or journeys with the most potential, but rather the local authorities that have implemented policies to provide financial incentives for car-sharing through partnerships with an operator. Thus, in 2022, only one local authority in the ranking had not set up this type of incentive for carpoolers. The CPP data therefore seem to be more indicative of the financial incentives and communication and promotion practices of local authorities and car-sharing operators, than of the real potential for the development of car-sharing in the long term.
The attributed decarbonization potential is itself overestimated, as it does not take into account rebound effects and competition with more environmentally-friendly modes.
The decarbonization potential of car-sharing is also overestimated, as it does not take into account rebound effects or competition with more environmentally-friendly modes of transport. Indeed, calculating the amount of CO₂ saved is relatively straightforward, as described on the Carpooling Observatory website: « CO2 savings are calculated on the assumption that if the passenger has travelled by carpooling, then they have not used their personal vehicle. This represents one less trip made by a car, and the same amount of CO2 saved. For example, in February 2023, when 814,779 carpooling journeys were recorded, the Observatory estimates a saving of 4,019 tonnes of CO2 over the month. These estimates are based on the assumption that car-sharing, which aims to optimize the existing system by filling more cars on the road, contributes to reducing road traffic and therefore overall CO2 emissions. The underlying assumption is that car-sharing passengers were initially car drivers, and that they use their cars less thanks to car-sharing. The reality, however, is more complex, and the CO2 savings are not as mechanical. Optimizing car use through car-sharing is likely to have a knock-on effect, reducing the estimated impact on decarbonization. By reducing the costs associated with car use, as well as travel time in the case of reduced traffic on congested roads, car-sharing can lead to an increase in car use. This can be seen first and foremost in an increase in demand for travel, made possible by lower costs (for both driver and passenger), or by a previously unavailable opportunity to travel (in the case of a non-motorized passenger). In the case of long-distance carpooling, a survey carried out for ADEME shows that 8% of drivers and 12% of passengers would not have travelled if they had not been able to carpool. 21% of drivers say they would travel less often without carpooling (ADEME-6t, 2015). A 2016 CGDD publication concluded that there was a slight increase in road traffic. For short-distance carpooling, the risk of inducing a higher volume of trips seems low in the case of home-to-work or home-to-study carpooling, insofar as these are constrained trips and this could enable non-motorized publics to access new opportunities (jobs, activities). However, by reducing the cost of a car journey, car-sharing can encourage households to live further away from the places where they carry out their daily activities, ultimately increasing the number of kilometers traveled by car. A second rebound effect leading to an increase in car use is the substitution of more ecological modes by car-sharing. Firstly, there may be competition with public transport when it is cheaper to travel by carpool than by public transport. For long-distance carpooling, this risk is well identified: a majority of passengers would have travelled by train (69%) according to the ADEME-6t survey (2015). For short-distance carpooling, the 2017 ADEME guide concluded that there was no competition with the rail offer, which is cheaper than carpooling thanks to the reimbursement of season tickets by employers. Since the LOM, this assertion can be questioned. Companies can now offer their employees the Forfait Mobilité durable (sustainable mobility package). What’s more, drivers can be remunerated in excess of the costs incurred to make the journey, and passengers can travel for free or for less than the cost of a public transport ticket, in some communities. Some car-sharing schemes have targeted public transport users directly, allowing holders of a season ticket for the transport network to take advantage of car-sharing journeys free of charge. One urban car-sharing operator, for example, uses this argument in its communications: « Fed up with public transport, waiting for the next bus or shrivelling up against the metro window every morning? With urban carpooling, all that’s behind you! » 10
Competition can also be seen in journey times: the flexible hours and locations of daily carpooling can effectively compete with public transport services based on timetables and delimited by transit lines. The flexibility of carpooling is emphasized by several of the people we met in local authorities, such as this elected representative: « Carpooling allows for finer organization, it meets a need in lace, public transport is such and such a place at such and such a time, whereas carpooling can be in front of the house, or a point accessible on foot. Carpooling has other virtues ». More recent transformations in mobility, such as the rise of telecommuting since the health crisis, are helping to make mobility more fragmented and « à la carte » 11. As part of the European COMMUTE project in the Toulouse-Blagnac airport zone, several companies in the sector and local authorities have been considering alternatives to the car. The feedback from two employees of companies taking part in the project is that carpooling, like cycling or the widespread use of telecommuting, should be integrated « into a package of services, to meet the demand for flexibility and multimodality ». For them, the question of the main mode of travel in mobility surveys is obsolete today, as people increasingly have a multimodal profile, using different modes in turn according to constraints or opportunities. The risk of substitution also exists in a longer-term perspective, insofar as the comparative advantage of the car over public transport could lead to a drop in ridership and justify the closure of existing lines. The risk of encouraging urban sprawl by reducing travel costs and the risk of competition with public transport are therefore possible rebound effects to be taken into account when calculating the decarbonization potential of car-sharing. Ultimately, there’s nothing mechanical about calculating CO2 savings: in addition to data on kilometers traveled and occupancy rates, we need to add information on carpoolers’ modal patterns (modes used, frequency, distances traveled, etc.). Coulombel and Delaunay (2019) model the impact of car-sharing development in the Île-de-France region and conclude that, if it develops strongly, « car-sharing is likely to lead to a modal shift from public transport and soft modes (walking, cycling, etc.) to the car, as well as an increase in the distances travelled by car ». The authors estimate that these rebound effects, largely the result of modal shift, would attenuate by 50 to 75% the environmental benefits initially expected from the development of car-sharing (in terms of reduced CO2 emissions). The impact of rebound effects is therefore significant in this model. However, this model is based on the Île-de-France region, whose particular situation is likely to significantly alter the results of such a model in another territory, less well served by public transport. So, in reality, the potential of daily car-sharing is complex to determine. A number of factors play a decisive role, in particular constraints (economic, lack of alternatives, lack of motorization, fixed schedules). Without these constraints, self-drive is preferred for the flexibility it allows, a flexibility that is sometimes indispensable in the case of additional imperatives (family, for example). In the absence of an overall picture that takes into account not only practices, but also the characteristics of individuals and their mobility practices, car-sharing remains difficult to grasp today and to imagine in the future. Two parallel dynamics, which may overlap, can be observed: informal practices, still largely in the majority, and practices via platforms and recorded by the RPC. Moreover, the existence of rebound effects complicates the calculation of car-sharing’s potential. Beyond the effects on decarbonization, it seems important to consider the broader ecological and social impacts of car-sharing development (accessibility, optimization of the automotive system) in a perspective of ecological transition of mobility. In the following section, we will take into account the different objectives of public car-sharing policies in order to determine the areas of relevance for car-sharing, i.e. where car-sharing will have the greatest impact on the ecological transition of mobility.
-
1 As a reminder, the definition of carpooling stipulates that the trip is made on the driver’s own account. (www.ecologie.gouv.fr/covoiturage-en-france-avantages-et-reglementation-en-vigueur)
-
2 Modal shares are taken from the ADEME-Inddigo 2015 study, based on ENTD 2008 data. In each case we retain the modal share for journeys where driver and passenger have the same reason for travel, in order to discard the accompanying reason.
-
3 For this calculation, we consider only the 3.3 million adult students who travel to a fixed place of study.
-
4 If 3 million carpooling journeys were made for home-to-work reasons, this would represent 6% of the 50 million daily journeys (25 million working people commuting to work every day). Source: Insee, 2021. « La voiture reste majoritaire pour les déplacements domicile-travail, même pour des courtes distances », Insee Première n° 1835, Janvier 2021.
-
5 The authors consider that the potential is greater for home-work journeys, due to the low occupancy rate and distances covered. They leave aside the question of travel loops for other reasons (shopping and other) made by private car: « they are already characterized by a high average fill rate (1.5), although there may be definite issues (average distance traveled of 8 km): this type of mobility - irregular - would require car-sharing policies (e.g. of the « hitchhiking 2.0 » type) that are difficult to assess ex ante. » (Raux et al., 2018)
-
6 A zoom on Ecov’s carpooling lines is presented in the negaWatt « Sobriété 2022 » scenario.
-
7 The Baromètre des mobilités du quotidien 2022 is a survey carried out by the Fondation pour la Nature et l’Homme and Wimoov, the first edition of which was published in 2020. The second edition, published in 2022 and entitled « Dependence on fossil fuels as a source of precariousness », was carried out between October and December 2021 among a large panel of French people (13,105 people, by internet and telephone). The survey looked at French people’s mobility needs and constraints, their ability « to move towards a solution that meets the environmental challenge, and the conditions for this change in practice. Among these mobility solutions is carpooling, which was included in the survey alongside carsharing.
-
8 According to our calculations, the figure of 4.5 million tonnes is obtained on the assumption that each journey avoided saves 5.8 kg of CO2 (a 30 km journey, for average GHG emissions of 195 g CO2 equivalent per vehicle-kilometre (national car-sharing observatory)). At 2.1 million daily trips, 365 days a year, this gives 4.5 million tonnes.
-
9 Alternatives économiques, « Le boom du covoiturage est-il lié à l’action du gouvernement?", Alternatives Economiques n°434 - 05/2023.
-
10 Description of a LinkedIn post from the « Citygo - urban carpooling » page published in June 2023.
-
11 The impact of telecommuting on carpooling raises questions; on the one hand, it individualizes commuting days, thus reducing the possibility of carpooling, while on the other hand we see the maintenance of days with a higher use of public transport, thus commuting to work (Tuesdays and Thursdays).