Increase in residential property prices: the effective weight for first-time home buyers
Politiquedulogement.com
Arnaud Bouteille, Bernard Villemade, October 2020
The issue of housing is a subject of interest or concern for many French people. Created at the beginning of 2015 by a group of specialists in the housing economy, the Politiquedulogement.com website aims to publish serious contributions to the debate on housing policy, without being academic or consensual. In this article, Arnaud Bouteille and Bernard Villemade analyse the weight of access to home ownership in the income of first-time buyers and highlight the growth of inequalities.

In many studies, the place of housing in the household budget is evaluated using the rate of effort, which relates the expenses incurred by the household to the income of the household occupying the dwelling. These expenses, from which direct housing subsidies are deducted, cover rent and charges for tenants, loan repayment annuities and charges for first-time buyers, charges for owner-occupiers released from loan repayments, and in all cases energy costs related to housing. This indicator allows valuable comparisons of housing costs according to occupancy status and income, and to monitor their evolution over time. A clear summary can be found, for example, in Les conditions de logement en France, Edition 2017 INSEE, p.160.
For first-time homeowners the calculated effort rate increases from 23.2% in 2002 to 26.6% in 2013. The same ratio evolves from 20.2% in 2002 to 24.1% in 2013 for tenants in the social sector and from 23.6% to 28.4% for tenants in the free sector. The interpretation of these variations should be made bearing in mind that from one date to another the composition of the groups defined by the occupancy status and/or the standard of living changes significantly. Furthermore, for first-time buyers, the indicator is fixed at a point in time, the date of observation, when the burden of loan repayment is temporary, and it says nothing about the total burden that a purchasing household will have to face over the duration of the loan, once its rate and duration are taken into account, and the effects of inflation during this period.
Knowledge of the purchase price, when reduced to the household income, provides essential information, but only partially illuminates the burden that the household will bear, in that it does not take into account financing conditions and inflation.
It is for this reason that a different concept is proposed here to analyse the situation of first-time buyers - households who buy a dwelling they occupy, whether or not they have previously owned other real estate assets: not to stop at the first annuities but to assess the total amount that the purchasing household will have to take, year after year, from its income to pay for the dwelling and repay its debt in full, relating each of the terms of this sum to the income of the year in which the payments are made. What is referred to in this paper as the « effective weight for the purchaser » is therefore expressed in income years.
This effective weight, this number of years of income devoted to becoming a homeowner, therefore depends first and foremost on the price of the property, the financing conditions - rate and duration of the loan, personal contribution - but also on the evolution of the borrower’s nominal income over the duration of the loan and on inflation. These last two parameters are of course unknown at the time the loan is set up, but the whole calculation can in principle be done a posteriori, after the last maturity date, and its result is specific to each household and to each acquisition.
However, it is significant to consider the average value of this effective weight for a generation of purchasers, a cohort of those who have purchased in the same year, or in the same group of years, and to compare it with cohorts from other periods. This is what we are trying to do here.
The necessary data can potentially be found in the housing survey, which has been conducted periodically by INSEE for a long time. Indeed, the survey distinguishes among the respondents recent purchasers, defined as owner-occupiers having bought in the 4 years preceding the survey, and records for each one the purchase price and the financing conditions. As for all the respondents, their income is provided.
On this basis, the INSEE salaries provide for the cohort the average purchase price of the dwelling, and the amount of the personal contribution, these two amounts expressed in years of income of the purchaser. Also indicated are the financing conditions, personal contribution, interest rate of the loan(s) and duration, again on average for the cohort.
However, these results are only published on the occasion of specific studies. For the present note, it has only been possible to use those from the 2002, 2006 and 2013 surveys. The three cohorts described here therefore correspond to owner-occupiers, having bought during the four years preceding 2002, 2006 and 2013 respectively.
These INSEE data are shown in green in the summary in Table 1.
Changes in home ownership conditions
First of all, we observe, not surprisingly over this period, the considerable increase in the ratio of the price of purchased housing to the income of the purchasers: from 3.1 years of income for the 2002 cohort to 4.7 years for the 2013 cohort, an increase of more than 50% in 11 years (for more complete information on the evolution since 1998 of property prices in relation to income, we can refer to the detailed data on the site Fonciers en débat: fonciers-en-debat.com/prix-de-limmobilier-residentiel-en-france-metropolitaine/).
There has also been an almost parallel growth in personal contribution: from 1.03 years of income to 1.5. This finding is well in line with the evolution reported in other studies, which show that in this period, home ownership has involved richer and/or more « endowed » households (assisted by the family, heirs).
Average interest rates decreased, as expected, in the observed period from 5.3% to 3.5%. It is known that this downward trend continued after 2013. Their level should be understood bearing in mind that this average is influenced by the incidence of PTZ (zero interest rate loans) in the composition of financing. The interest rates shown are those at the time the loans were put in place, many of which were subsequently renegotiated during this period. They will be lower.
Correspondingly, the duration of the loans is lengthening, from 15 to 20 years over the period. Again, the original nominal term is indicated, while a significant proportion of loans are repaid early.
With these data, and for the cohorts considered, we can approximate the effective weight for the occupying buyer, as defined above, over the duration of the loan and in relation to his income at the time of each payment. This is based on the hypothesis that the latter varies, on average for the cohort, as does the median standard of living of the metropolitan population, a figure taken from the INSEE series. Each payment in the form of a personal contribution or annual repayment, calculated according to the characteristics of the loans, can then be related to the nominal income of the year in question, and this series totalled over the duration of the loan then gives the effective weight of the acquisition, in years of income. It is clear that in this reasoning, the personal contribution is taken into account, at its date, as a component of the effective weight and whatever its origin - prior savings of the household, assistance provided by the family, or proceeds from the sale of a property -. It is in fact a payment that the purchaser allocates to his purchase rather than to other uses.
It should also be noted that the simplification of equating the increase in the standard of living of first-time buyers with that of the general median standard of living probably underestimates the increase in the net income of first-time buyers, among whom people in the process of professional advancement are over-represented. This specificity probably leads to an over-estimation bias in the effective weight as defined above. However, it can be considered that this bias affects in a similar way the 3 periods studied, and that the comparison of the effective weights calculated for each of the 3 cohorts is relevant; a comparison whose analysis is the subject of this note. Finally, the use of a standard of living index to calculate a change in income is questionable. Calculations made using the index of change in gross disposable income per consumption unit yielded results very little different from those presented here, without affecting the conclusions.
For the 2013 survey cohort, the loan maturities are after 2019. Thus, three hypotheses of changes in the median nominal standard of living, from 2019 to 2033, 1%, 2% and 3% per year, were taken into account, framing the assumptions that can be made about inflation (except in the case, not dealt with here, where the economic crisis resulting from the health crisis would lead to a return to high inflation). It should be noted that the differences between these 3 hypotheses are significant but do not change the orders of magnitude of the movements observed.
The impact of loan renegotiations should also be taken into account. To this end, a model has been constructed which incorporates the fact that loans are renegotiated each year as soon as the difference between the loan rate and the market rate reaches 1.5%, and that the borrower then benefits from the new rate by bearing, in the year of the change, a penalty of 1% of the outstanding capital. The model considers the average rates of the loans of the cohort, in this average including PTZ (zero rate loans) when they exist, and which obviously are not subject to renegotiation. Their share in the loans is sufficiently reduced so that the results are not significantly modified.
To sum up, the sequence of calculations based on INSEE data, for each cohort of first-time home buyers in the four years preceding the date of the survey, involves the following steps:
-
From the average loan data (rate and term), calculation of an average repayment annuity.
-
Comparison, for each year, of the average rate of the cohort’s loans with the average rate of new loans for the year in question.
-
When the difference thus observed is more than 1.5%, calculation of the annual repayment of a new « renegotiated » loan, assuming that the overall duration of the loan remains unchanged. The renegotiation cost of 1% of the outstanding balance is added to the repayment charge for the year in which the interest rate changes; if the repayment charge calculated in this way is lower than the initial charge, the new loan is validated, otherwise it is waived.
-
Calculation of average income for each year by indexing the average income given for the year of origin to the change in the average standard of living published by INSEE.
-
Each annuity adjusted as above is related to the income for the year in question. This report therefore expresses the share that, for that year, the household had to draw from its income to repay its loan. This ratio is homogeneous with a number of years of income.
-
The arithmetic sum of these ratios, over the duration of the loan, then provides the « effective weight », as defined above, the total of what the households in the cohort will on average have spent on repaying the loan rather than on other consumption, also expressed in years of income.
Sharp increase in the effective weight of home ownership
The results of the authors’ calculations using the above methods and assumptions are shown in blue in the table below:
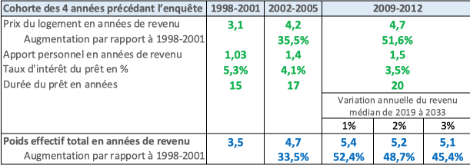
Note : The data shown in green above are, for the first two cohorts, taken from the note Pierrette Briand « L’accession à la propriété dans les années 2000 » INSEE Première n°1291 May 2010, and for the last one, from « Les conditions de logement en France » INSEE Edition 2017 p.157. These two sources diverge very slightly on the price data for the first cohort (3.2 instead of 3.1), without this difference having a significant impact on the results presented here.
The increase in the effective weight, as defined above, is spectacular: in 11 years, for owner-occupiers, the share of income that the households concerned have to allocate to becoming owners of the housing they live in increases from an average of 3.5 years of income to 5 years or more, a growth that is close to 50%. For the 2013 cohort, the differences between the 3 inflation assumptions after 2019 are significant but do not reverse the direction of the conclusions. This increase is well correlated with the increase in residential property prices in this period, as might be expected. as might be expected. We also observe the parallelism of this evolution with that of the purchase price in relation to income, at the time of acquisition, as noted by the INSEE (figures at the top of the table), which clearly shows that this increase was in no way offset by the decrease in interest rates, This very real reduction has certainly enabled the duration of loans to be extended and thus the amount of each annuity to be contained, but the increase in the number of annuities in a context of low inflation is taking up this advantage, and the effective weight for the buyer remains very much increased. Note: The data shown in green above are, for the first two cohorts extracted from the note Pierrette Briand « L’accession à la propriété dans les années 2000 » INSEE Première n°1291 mai 2010, and for the last one, from « Les conditions de logement en France » INSEE Edition 2017 p.157. These two sources diverge very slightly on the price data for the first cohort (3.2 instead of 3.1), without this difference having a significant impact on the results presented here.
Growing inequalities with regard to home ownership
For large cohorts, more than 600,000 households each year, this represents a considerable change in the weight of home ownership for the most recent generations. This evolution is quite brutal if we consider the short period of time over which it has occurred. Moreover, there is much evidence to suggest that it has not corrected after 2013, a period in which house prices relative to income have remained roughly constant and have even increased further in some metropolises1.
Thus, the angle of observation proposed here complements and amplifies earlier findings on the evolution of the share of owner-occupiers in the total housing stock.
It should be borne in mind that this share had risen from 42.2% in 1963 to 56% in 2002, this spectacular rise having itself reached a plateau between 1988 and 1996. Since 2002, close to the start of the rise in house prices, this share has apparently remained stable at around 57 to 58% of households. Jean Bosvieux had pointed out that this apparent stability was determined by the strong demographic weight of the baby boom generation, which is massively homeowner, and that this factor, by its temporary nature, masked a heavy downward trend 2.
Another striking component of this phenomenon is the intensification of inequality in access to home ownership, depending on the standard of living. Its evolution is precisely described in INED Working Note 234, July 2017 3 from which Figure 1 below is extracted.
Focused on households whose referent is aged between 25 and 44, those where there is a very massive concentration of first-time homeowners, it shows to what extent the standard of living criterion, which was still not very discriminating in 1973, is gradually taking on a decisive weight in determining the probability of being an owner-occupier:
Graph 1
Home ownership rates by standard of living quartile, among 25-44 year olds, 1973-2013
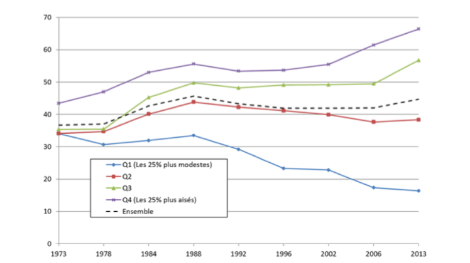
The rapidly accelerating divergence between quartiles speaks for itself. The general trend is the gradual establishment of a very strong correlation between employment status and standard of living. Increasingly, higher standards of living are owner-occupied, and symmetrically, tenant status is linked to modest income.
As regards home ownership, data are accumulating which associate the rise in property prices over the last two decades with a heavy transformation:
-
Home ownership is tightening on higher living standards.
-
It requires a significant personal contribution from the first-time buyers, equivalent to 1.5 years of income, which is difficult to raise through prior savings alone, and is therefore increasingly dependent on the possibility of mobilising family support.
-
Although they have a higher income, the households that commit themselves to it must devote a strongly increasing part (+50%) of this income to it, and/or have an increasingly large contribution, compared to the generations that bought before the upward movement.
It is very likely, in view of the trends observed, that if we had access to data for the 1960s and 1970s, we would see that the acquisition costs expressed in years of income were lower and that the inflation context at the time rapidly reduced the real value of annuities, resulting in a lower effective weight than that observed for the 2002 cohort, and further accentuating the trends described here.
Opposite these purchasers, led to a very increased effort, are the sellers of old housing or land for new housing. They are mechanically the beneficiaries of these very increased flows. The profiles of these selling households - standard of living, origin of the property sold - are very varied. However, one strong characteristic stands out: they are older than those who buy from them. In fact, if we classify households by age of the reference person, it is from the age of 57 onwards that they are overall net sellers of property (they sell more than they buy) [4].
The increase in the burden of first-time buyers reflects a transfer between generations. The large-scale phenomenon described here for residential property is part of a strongly felt societal movement: an economy that is less welcoming for the youngest compared to the oldest, harder for outsiders to the advantage of insiders.
-
1 Cf. la note “Prix de l’immobilier en France métropolitaine“ déjà citée sur le site Fonciers en Débats.
-
2 Jean Bosvieux, “Recul du taux de propriétaires en France“, politiquedulogement.com, 5/12/2018.
-
3 Carole Bonnet, Bertrand Garbinti, Sébastien Grobon, “Inégalités d’accès à la propriété et de richesse immobilière en France”. INED, Document de travail 234, Juillet 2017
-
4 Jacques Frigitt works, CGEDD, in Eric Tréguier “Immobilier. Qui achète et qui vend son logement, et à quel âge ?” Challenges, 24/09/2019
The issue of home ownership is one of those that most directly concerns the French and has an impact on society as a whole. For the overwhelming majority of families, real estate represents most or all of their assets and it is therefore not surprising that they see home ownership as the almost unique way of building up their assets.
In the majority of cases, too, home ownership is also the preserve of relatively young people, often as a couple or family, who buy for housing and have to go into debt, even if they are fortunate enough to be helped by their families. In four out of five cases, they buy an existing house, or a flat in an existing building, and then generally from people who are a generation older and who are reaching an age where they want to build up this wealth.
The total effort involved in home ownership over the duration of the loan depends on the level of contributions, the rate of the loan and its duration, but also on the effects of inflation, which over the years lightens the real value of this burden. The real cumulative amount of this burden is therefore both an indicator of the effort that home ownership represents in the life of a family and of the extent of the transfers that take place from one generation to the next at the time of sale. According to the authors, and with very convincing arguments, the most significant indicator is constructed by calculating the amount of the charge year by year, relating it to the household income of the same year, and adding it up over the duration of the loan. This is what they refer to as the « effective weight », which is then expressed in years of income and represents what the purchasing household will have had to spend on it rather than on other consumption to build up this wealth.
Based on various INSEE studies and by cross-checking the information, they conclude that in twelve years, from 2000 to 2012, a period of rapid rise in property prices, this effective weight increased by 50%, rising on average from 3.5 to 5.2 years of income. This is very spectacular, and probably a continuation of an already long-standing trend. We remember that in previous decades property prices were more moderate, and higher inflation eased the burden of annuities more rapidly.
What the article shows is that the sharp reduction in interest rates in this period, combined with longer loan terms, has as we know, allowed households to borrow more and buy more expensive housing, but that the reduced inflation, unlike in previous periods, has not gradually eased their burden. All in all, the rise in house prices has resulted in an increased transfer from the younger generations to the older ones, from those entering to those leaving.
These mechanisms are of the utmost interest at a time when the Citizens’ Climate Convention has put forward as one of its flagship measures the obligation of thermal insulation of real estate properties at the time of their transfer. However, if today this thermal insulation work, which has been called for for years, is carried out at such a slow pace, it is notably as other articles in the magazine Politique du logement have shown because, given current energy prices, the payback times for heavy thermal insulation operations are very high. It is interesting to ask, in the light of the evolution of the rate of effort of households in home ownership, who would ultimately bear, the seller or the buyer, these investments « at a loss ».