Artificialization of soils : state of play of a complex challenge - Synthetic portrait of the distribution of artificial land
Rémi Guidoum, June 2022
Fondation pour la Nature et l’Homme (FNH)
After 30 years of action, the Fondation pour la Nature et l’Homme is giving a new ambition to its Think Tank activity, which was born about ten years ago. Starting with the question: « What would a government determined to make the ecological transition do?", the Foundation’s Think Tank focuses on the « blind spots » of public policies by untangling the subjects that are bogged down or even unexplored. Its ambition: to create the conditions for a next five-year period of social and ecological transformation.
Based on a complex notion, recently redefined by the « Climate and Resilience » law and fuelled by historically disparate data, the debates relating to soil artificialisation are often difficult to access for the uninitiated, and sometimes lead to confusion. Despite its new definition, the notion of soil artificialisation remains trapped in a binary vision between artificialised and non-artificialized soil.
This dichotomy is maintained by monitoring tools that focus on the surface of the land, without characterising it in depth or measuring the ecological impacts actually induced on the ground. However, not all areas classified as artificial are equal from an ecological point of view, just as land uses considered as non-artificial are not necessarily favourable to biodiversity. The policy of sober land use must therefore be equipped with tools that allow for a detailed description of situations, in order to be able to reduce the consumption of space while favouring biodiversity throughout the territory. In addition to presenting the definitions and impacts, this contribution provides a summary of the distribution of built-up land in metropolitan France (geography and uses)
To download : tt-contribution-sols.pdf (7.7 MiB), artificialisation-des-sols-synthese-en-francais-1.pdf (4.7 MiB), egs_2021_28_calvaruso_03-29.pdf (2.6 MiB), primeur326.pdf (2.7 MiB)
Annual stocks and flows: key figures on soil artificialisation
In an Agreste file published in April 202119 and based on data from the Teruti-Lucas surveys (see above), the Ministry of Agriculture and Food gives the following overview as of 2018:
-
Agricultural land occupies 28.5 Mha, i.e. 45% of French territory including DOM. In metropolitan France, agricultural land occupies 52% of the territory.
-
Natural areas (wooded land, moorland and wasteland, natural bare land and areas under water) occupy a surface area of 30.3 Mha, i.e. 47% of the French territory including DOM. In metropolitan France, the surface area of natural areas is 21.7 Mha, or 39% of the territory.
-
Artificial land covers a total surface area of 5.0 Mha, i.e. 8% of the French DOM territory and 9% of the metropolitan territory20. Artificial soils are divided between surfaces made impermeable (44%) and surfaces that remain permeable (56%). Built-up areas account for 17% of artificial soils (850,000 ha), while paved or stabilised soils (roads, car parks, tracks, railways) account for 44% of artificial soils (2.2 Mha).

According to Teruti-Lucas data, the surface area of artificial land increased by 72% between 1982 and 2018 in mainland France, from 2.9 to 5.0 million hectares, while the population grew by only 19%. Land files show that for 26% of French municipalities, artificialisation increased while the number of households decreased over the period 2011-201621. The decorrelation between population dynamics and the growth of artificialisation of land is an important element to integrate into the reflection.
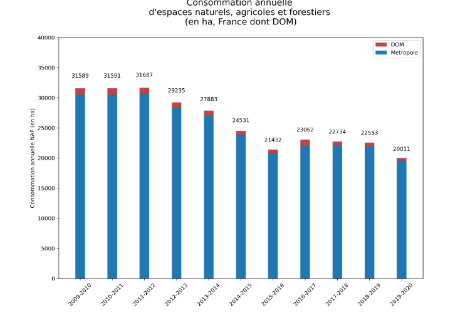
By analysing these land files, since 2019 Cerema has published annual statistical monitoring of the consumption of ENAF dating back to 2009, available via the land artificialisation portal. This monitoring indicates a drop in the rate of consumption of ENAF between 2009-2010 and 2015-2016, from approximately 31,600 ha to 21,400 ha per year, with a slight rebound in the following years, then a new drop in 2019-2020 (possibly linked to the Covid-19 context).
These data also show that the contribution of municipalities to the artificialisation of land is very unevenly distributed over the territory. Thus, Cerema (2020) notes that between 2009 and 2018 ‘5% of municipalities are responsible for 39.7% of the consumption of space’ and 20% of municipalities concentrate 81.7% of this same consumption. This statistical concentration nevertheless masks diverse realities, since artificialisation is manifested as much by numerous small-scale development projects as by a small number of large-scale development operations (Ibid.).
Artificial development is concentrated around the major cities and the coastline
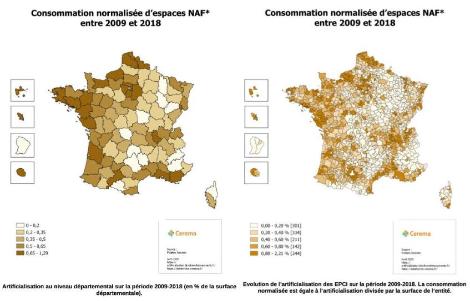
On the basis of land files, Cerema (2020) has carried out a comparison of artificialisation in the various regions of France over the period 2009-2018 (graph below). It can be seen that the decline in the rate of artificialisation is found in all metropolitan regions (although the 2015-2018 range masks the rise in the rate after 2016 in some regions), and that there are significant disparities between these regions.

Analysis at the departmental level allows Cerema to clarify this observation, emphasising that artificialisation is concentrated primarily around the major metropolises and in coastal areas, while the more rural departments are comparatively less affected (for example, eastern France from the Aisne to the Jura, the Massif Central, and the Alps excluding Haute-Savoie).
Distribution of space consumption by type of commune
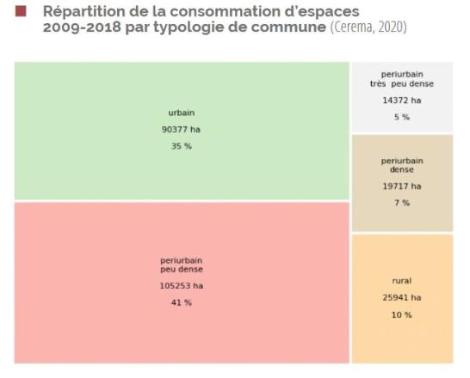
In addition to the location of new artificial spaces, it is interesting to study the consumption of space according to the types of municipalities concerned (urban, peri-urban, rural, etc.). Cerema (2020) has carried out this analysis for the spaces consumed over the period 2009-2018 and produced the graph opposite. It can be seen that the communes in the ‘sparsely populated peri-urban area’ are those which consumed the most ENAF between 2009 and 2018, with 41% of the total. The urban communes come in second place with 35% of the total consumption over the period.
However, these consumption figures should be read in the light of the distribution of households and economic activities between the different types of municipalities. Thus, Cerema notes that, over the period 2011-2016, while urban municipalities account for 36% of new space consumption, they accommodate 60% of new French households. By way of comparison, over the period 2011-2016 :
-
communes in the ‘low-density suburban’ category received 26% of new households but concentrated 41% of space consumption;
-
rural municipalities receive 2% of new households and account for 10% of new space consumption;
-
In contrast, the communes in the dense peri-urban category receive 10% of new households and account for 8% of space consumption
Distribution by land use: distinguishing between artificial and impervious land
Having described the distribution of artificial land use by geographical area and by type of municipality, let us now look at the distribution by use. With regard to the stock of artificialised land, Teruti-Lucas data indicate that their main uses, in mainland France in 2014, were as follows22:
-
42% for housing (built volumes and associated artificial land) ;
-
28% for transport infrastructure - 23.9% for road networks alone
-
30% for economic land (companies, commercial areas, warehouses, agriculture, public services).
Between 2006 and 2014, almost half of the newly developed land was used for housing. However, housing induces proportionally less waterproofing than other uses. Only 45% of the surfaces artificialised for housing are built on, paved or stabilised. Conversely, 90% of the surfaces intended for transport infrastructures or economic activities are waterproofed: this higher proportion of waterproofing logically induces more severe impacts on ecosystems (see above). In residential areas, it is therefore crucial to limit the rate of sealing as much as possible and to mobilise the available surfaces to favour biodiversity through adapted infrastructures and ecological continuities.
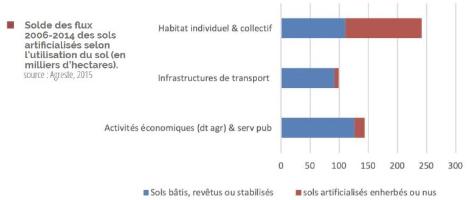
The graph below, taken from the INRA-IFSTTAR scientific expertise (2017, op cit.), shows that in terms of surface area, economic uses have sealed more soil than housing over the period 2006-2014, while transport infrastructures are at a comparable, albeit slightly lower, level. Economic activities are thus responsible for 37% of new soil sealing between 2006 and 2014, compared with 30% for individual housing and 4% for collective housing23. In terms of impact on biodiversity, the primacy of the responsibility of individual housing should therefore be put into perspective - although it does consume more ENAF than other uses - especially as the residential spaces that remain permeable have a significant potential for ecological gain, provided that suitable ecological facilities and management are put in place (e.g. replacing walls and fences with new ones). e.g. replace walls and fences between plots with hedges of varied and local species, recreate ponds, introduce differentiated mowing practices, etc.).
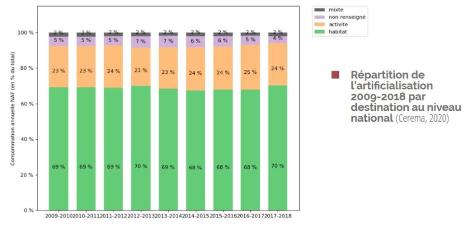
Based on land files rather than on the Teruti-Lucas survey, Cerema distinguishes between three types of land use: housing, activity and mixed use. Roads are classified in one or other of the categories according to the destinations they serve. In addition, there is a « not known » category. On this basis, Cerema indicates that at national level in 2018, 70% of new artificial land use is intended for housing, a relatively stable proportion over the years. However, it should be noted that this analysis does not distinguish between artificialisation and sealing.
Furthermore, it is important to take into account the fact that the different land uses (housing, activity, etc.) are not uniformly distributed over the territory. Thus Cerema (2020) indicates that approximately one commune in two does not artificialise land to accommodate economic activity, whereas almost all communes artificialise new land for housing.
If the metropolisation of the territory is a ‘driving force’ for land artificialisation, the attractiveness of the coastline is another. Cerema (2020) notes an « increase in the consumption of space » in coastal areas, which « can be explained in part by their attractiveness, as well as by the developments used for tourism ».
This question of the drivers of artificialisation, i.e. the structures and conditions that fuel this phenomenon, is crucial in order to design public policies capable of preserving land in an ecologically efficient and socially just manner. The analysis of the drivers of land artificialisation will thus be the subject of a dedicated publication of the FNH Think Tank.
Metropolisation of the territory and soil artificialisation
Cerema (2020) describes metropolisation as the ‘driving force’ behind soil artificialisation, an observation taken up by the Observatoire des Territoires in its February 2021 report entitled La France en douze portraits. One effect of this metropolisation of the territory can be observed by analysing what is called the ‘specialisation rate’, i.e. the proportion of artificialisation destined for housing in each commune. Cerema notes that this specialisation rate decreases with distance from the centre: this means that the closer the municipality is to the centre of the conurbation, the more land is developed for activity. Conversely, the further away from the centre, the more land tends to be developed for housing. According to Cerema, this phenomenon is partly due to the metropolisation effect, with the idea that the concentration of activities in the heart of metropolises means that the central municipalities meet not only the needs of their population in this area, but also the needs of the surrounding population.
Conclusion
Far from being a binary phenomenon, soil artificialisation manifests itself in various ways, the consequences of which depend on the nature of the activities implemented and the initial context. It therefore needs to be monitored with tools adapted to this complexity, allowing the study of soils not only at the surface but also at depth, and considering the ecological impacts at the landscape level.
Beyond the necessary reduction in the consumption of space, the policy of land sobriety is a global project, which must integrate at all levels the issues of biodiversity and social justice. In this perspective, the question of the drivers of land artificialisation is central, in order to be able to treat not only the symptoms but also the causes of the phenomenon.
Thus, the FNH Think Tank will soon propose a synthesis of the main drivers of land artificialisation in France, before launching a reflection on possible responses in terms of public policies. This work will seek to propose measures that contribute to achieving the objectives of reducing the consumption of space, without increasing inequalities or harming biodiversity. For example, it will be a matter of thinking about public action capable of reconciling land sobriety, access to housing and services, and the promotion of biodiversity in all areas.
-
19 Agreste, Les Dossiers, L’occupation du sol entre 1982 et 2018, avril 2021
-
20 A titre de comparaison, la méthode des fichiers fonciers donne un résultat similaire : 9,58% des sols sont artificialisés en France métropolitaine en 2018 (Cerema, 2020). Les différences de résultats entre les deux méthodes concernant davantage les flux annuels d’artificialisation que l’évaluation du stock de sols artificialisés.
-
21 Cerema, L’artificialisation et ses déterminants d’après les fichiers fonciers, avril 2020
-
22 INRA-IFSTTAR, 2017, op cit.
-
23 Comité pour l’Économie Verte, Les instruments incitatifs pour la maîtrise de l’artificialisation des sols, 2019, p30